Measure bundle size in your Angular apps
Analyze angular bundles through source maps
Website performance is key to ensuring a good user experience. Multiple modules and multiple external npm references make your website very heavy and slow to load. The goal should be to ship the smallest and faster javascript to your browsers.
What is a source map?
Source maps are a way to map a combined/minified file back to an unbuilt state. When you build for production, along with minifying and combining your JavaScript files, you generate a source map that holds information about your original files. When you query a certain line and column number in your generated JavaScript you can do a lookup in the source map which returns the original location.
What is source-map-explorer?
The source map explorer determines which file each byte in your minified code came from. It shows you a treemap visualization to help you debug where all the code is coming from.
Installation and Usage
Firstly, install source-map-explorer, run:
npm install -g source-map-explorer
Running source-map-explorer is easy:
ng build --configuration production
source-map-explorer dist/my-angular-app/**/*.js
or, you can also add this to the app script to create a shortcut.
{
  "bundle:report": "source-map-explorer dist/my-angular-app/**/*.js"
}
And then run,
ng build --configuration production
npm run bundle:report
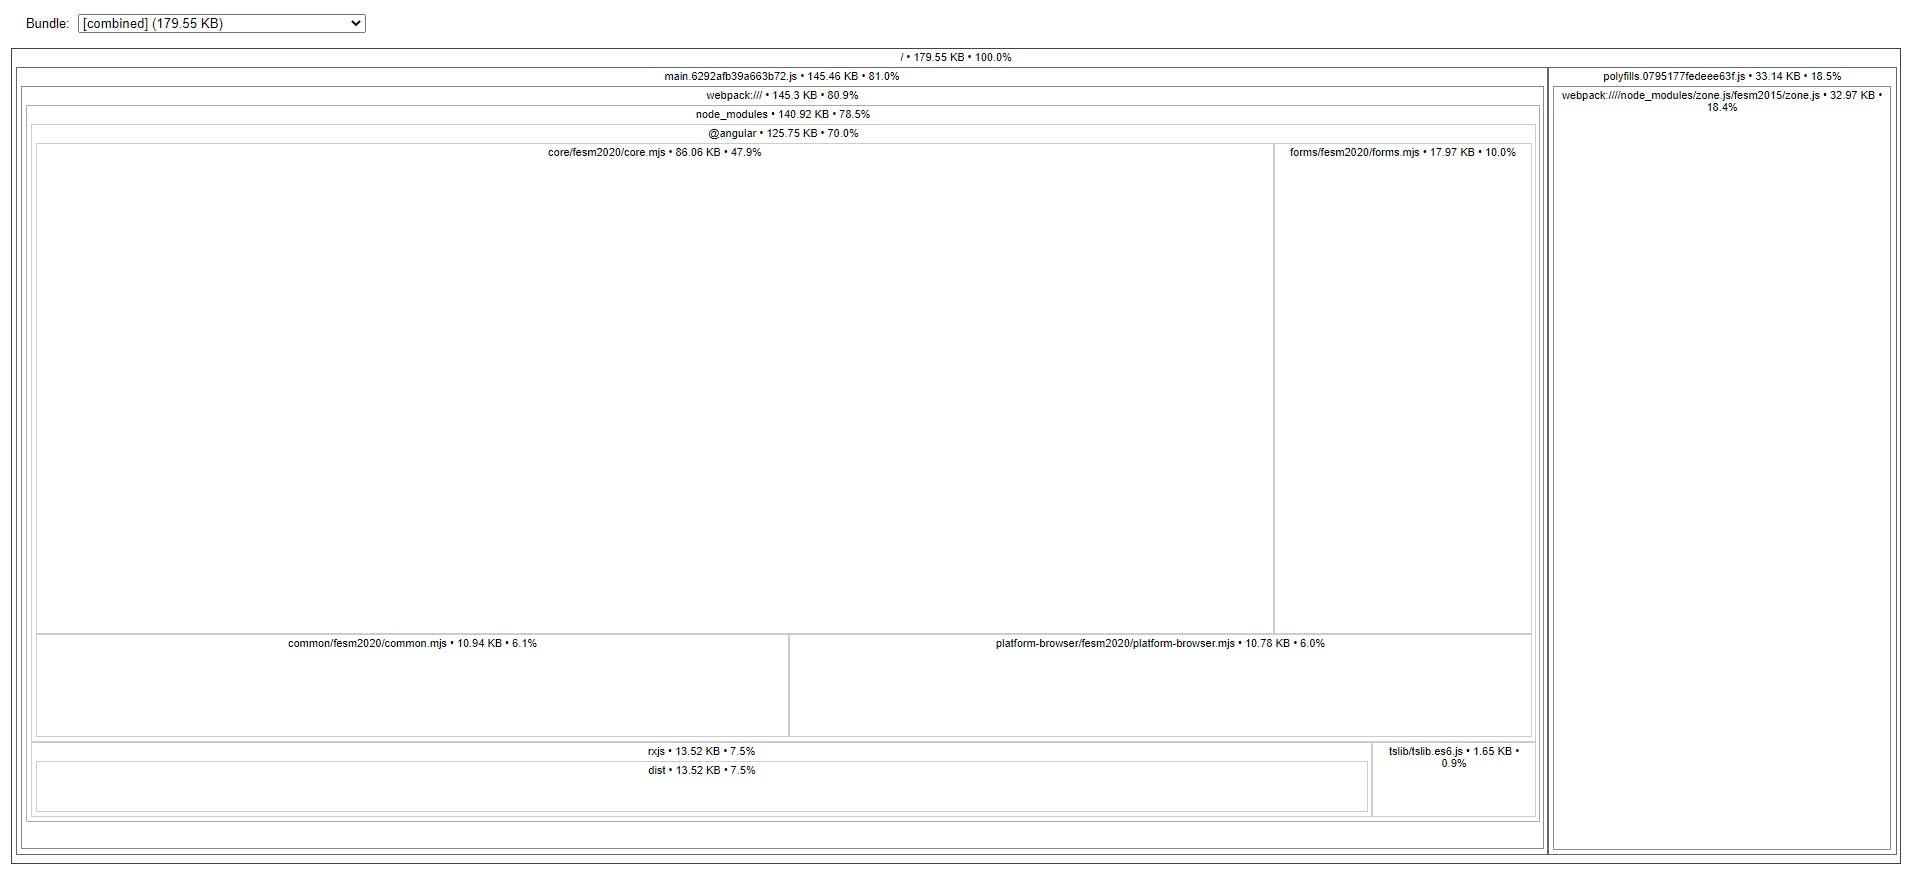
Output:

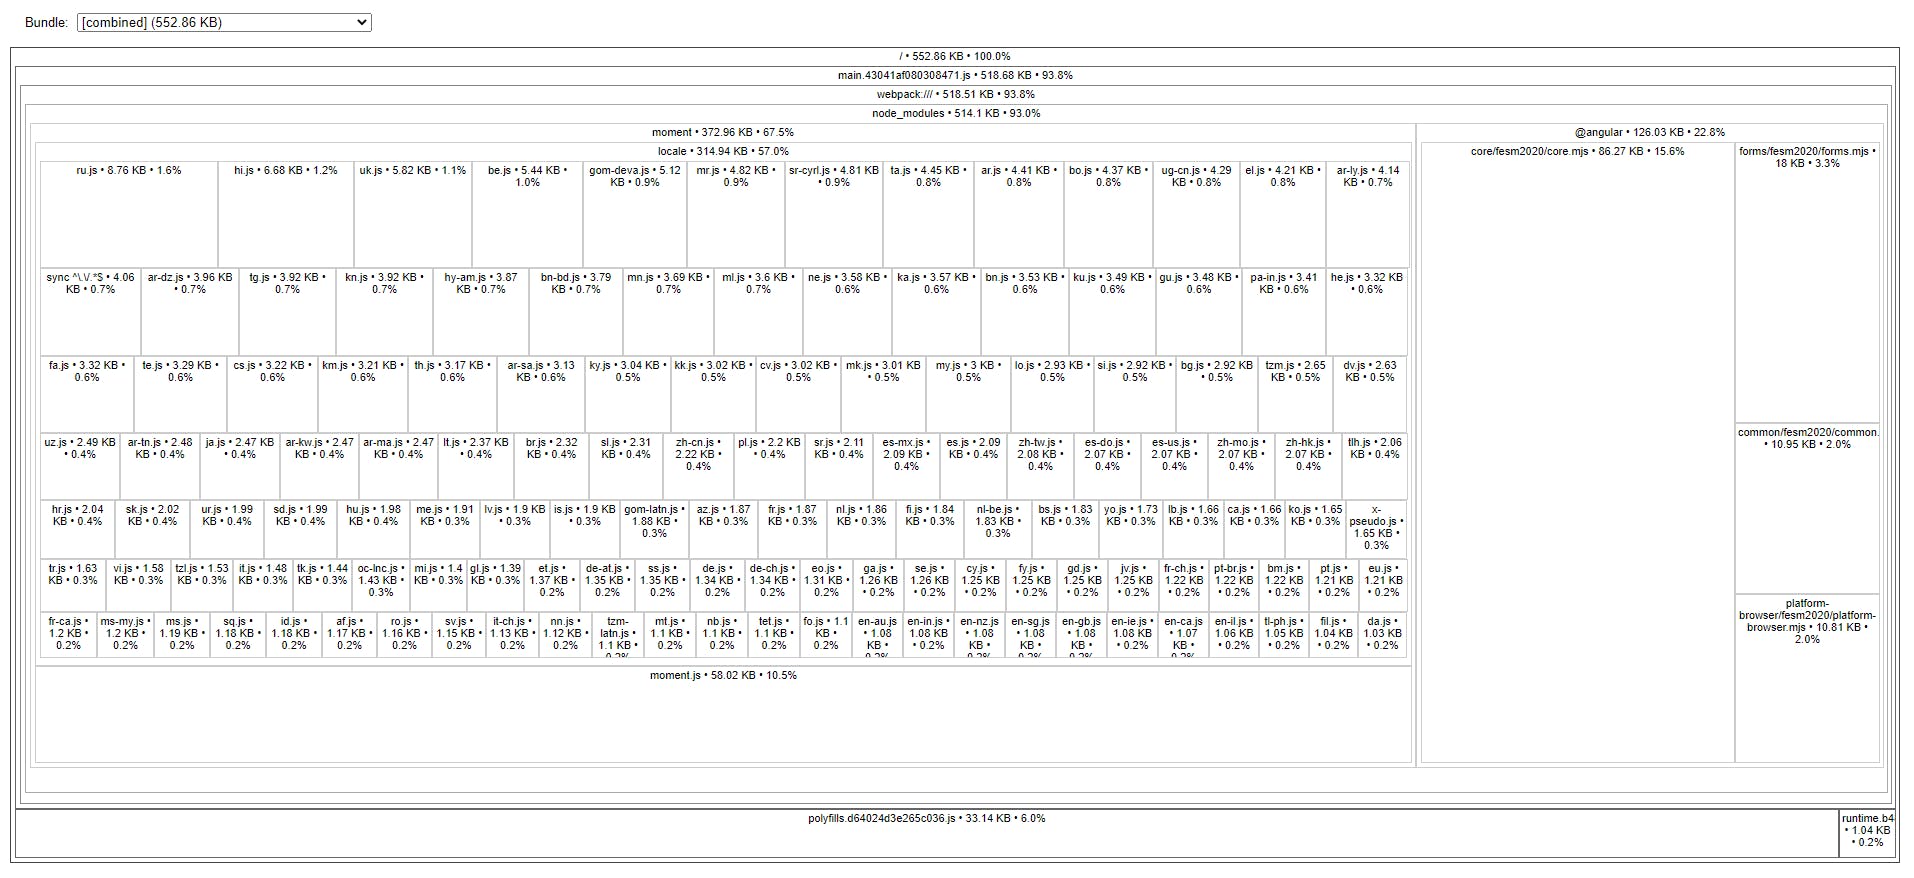
After installing moment.js and using it in one of the angular components

The difference is clear. The treemap shows a detailed, chunkwise information on code occupying space in your bundle. This helps easily identify pain points in your application being slow.
There are multiple ways you can improve and reduce the initial/main.js chunk size:
1. Removing unused references to external node modules.
2. Lazy loading of angular modules. This creates a separate chunk file for each lazy-loaded module for deferred loading.

Reference:
A great video by Google Chrome dev - https://youtu.be/B-lipaiZII8
